|
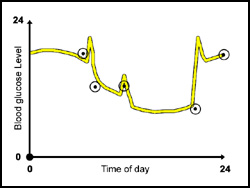
Figure
1
presents simulations and measurements which were performed on
a diabetic subject. The solid line represents the simulation output
for the entire day, while the dots represent the blood glucose
measurements.
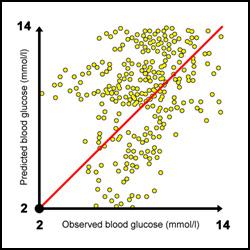
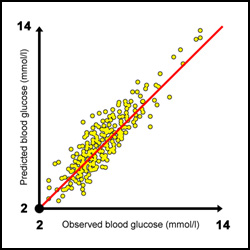
Figure 2 and Figure 3 respectively shows the predictive quality of the AIDA software(the only competitor) and our software.
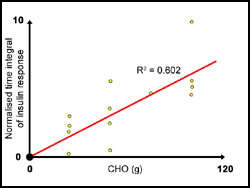
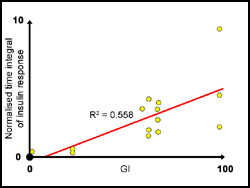
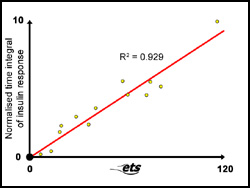
Let us investigate the quality of predictions
for insulin requirements using the well-known CHO mass or GI methods.
The results for the CHO and GI experiments for one test subject
are shown in Figure 4 and Figure 5 respectively.
Pearson’s R²- values were calculated for linearized
trend fits through the plotted data.
The R²-values for the CHO and the GI methods were 0.603 and 0.558 respectively for the example test subject. For the CHO method the worst spread was found at 50 g of CHO, namely a factor of 12, while for a GI at 65 the spread factor was close to 3. From
the figures the need for a better insulin prediction method according
to ingested carbohydrates is obvious. Therefore, our The
quality of insulin predictions according to the The
linear trend line for the |
|